Flying H, NM Hail Storm – September 2025
September 9, 2025 hail storm near Flying H, NM. Radar-confirmed hail track and contractor lead lists available.
Max Hail
1.75"1.25" est.
confirmed
Zones
2
NWS alerts
Radar
34
dual-pol hits
Spotter
–
field reports
NWS WARNING AREA · Flying H Metro · Sep 9, 2025
Intelligence Platform
StormSnipe Pro
$49/ mo
Cancel anytime · No contracts
›All 50 states
›No zone limits
›No per-event fees
Subscribe to Pro
Pro renews monthly until canceled · Cancel anytime in the billing portal
What's included
Instant delivery
Every storm published within hours of NOAA confirmation.
Interactive Strike Map
Full radar-confirmed hail track on an interactive map.
Address CSV export
Every affected residential address, export-ready.
Smart alerts
Notified when a storm hits your area. Set zones once.
Nationwide coverage
All 50 states. No zone restrictions. No geographic caps.
Live pipeline
NOAA NEXRAD processed and delivered 24/7.
Address data notice
Pro coverage in California, Vermont, and Oregon includes the confirmed hail track and Strike Map only — no address lists. State data-privacy law treats compiled address lists differently in those three states, so we exclude their addresses from extraction and delivery.
NWS WARNING AREAS · 2
This storm generated 2 NWS alert zones. Pro access covers the complete storm track and all addresses across every zone.
ZONE 1NWS ABQ
Flying H, NM
Dual-Pol Radar
6 addresses in warning area
Alert issued Tue, Sep 9 · 8:55 PM UTC
1.75"
confirmed
1.25"
est. (NWS)
ZONE 2NWS ABQ
Jemez Springs, NM
Dual-Pol Radar
2 addresses in warning area
Alert issued Wed, Sep 10 · 1:38 AM UTC
1.5"
confirmed
1"
est. (NWS)
Flying H, NM saw a concluded hail storm on 2025-09-09 with a peak confirmed hail size of 1.25 inches. Two radar-backed alerts tracked the storm through the afternoon and early evening.
What Happened
The first alert came at 2:55 PM MDT with 1.25-inch hail confidence from dual-polarization radar. A second alert followed at 7:38 PM MDT with 1-inch hail confidence. The sequence shows two hail-producing periods in the same day, with the stronger signal in mid-afternoon and another round later in the evening.
The storm is no longer active. Both alerts were issued for the Flying H area and reflect separate hail signatures within the same event window. The peak size in the report was 1.25 inches.
Damage Assessment
Hail in the 1-inch to 1.25-inch range can leave dents in metal roofing, trim, vents, and HVAC fins. Asphalt shingles may show bruising, scuffing, or displaced granules. Soft metals and exposed roof edges are common check points in this size range.
Windows, skylights, and vehicle surfaces in the warning area may also show impact marks, especially where hail fell in the stronger afternoon pulse. Smaller outbuildings, gutters, and unprotected siding deserve a close visual check. In multi-zone events like this one, roof conditions can vary across a short distance, so field crews should verify each address rather than rely on a single broad impression.
The two-alert pattern raises the chance of mixed impact levels across the community. One part of the route may show only cosmetic marks while another shows more concentrated roofing damage. Crews should note ridge caps, pipe boots, soft metal flashings, and south- or west-facing slopes where impact often shows first.
What Contractors Should Know
Prioritize the early afternoon and evening hail windows when scheduling canvass routes. The 2:55 PM MDT alert came first and carried the stronger hail signal. The 7:38 PM MDT alert followed later with 1-inch hail confidence. Both times belong in inspection notes and estimate packets. Use them to frame the likely exposure window for roof, siding, and vehicle claims.
For Flying H, NM, the 1.25-inch peak is large enough to justify targeted roof checks on asphalt shingle, metal, and low-slope systems. Start with east-west roof planes, soft metals, and impact-prone accessories. Document slope-specific findings, flashing condition, and collateral hits on vents, gutters, window screens, and exterior trim. Separate cosmetic impact from functional damage in your notes. That keeps repair scopes cleaner when multiple properties in the same warning area show different levels of loss.
If you are organizing a lead pack, group addresses by likely exposure to the stronger hail period and flag properties with older roofing or exposed accessories. Keep attic and interior checks tied to visible exterior findings. For insured losses, clear photos of granule loss, cracked components, and dented metal help support follow-up review.
Storm Details
- Start Date
- Tuesday, September 9, 2025
- Last Activity
- Tuesday, September 9, 2025
- Location
- Flying H, NM
- Warning Areas
- 2
- Dual-Pol Radar
- 34
- Spotter Reports
- --
Preview Strike Map
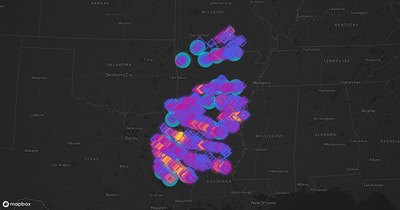
See exactly what you get.
Explore the full Springdale, AR Strike Map free – hail track, address overlay, and CSV download. No account required.
Try the Free Demo →